Characterization Facilities
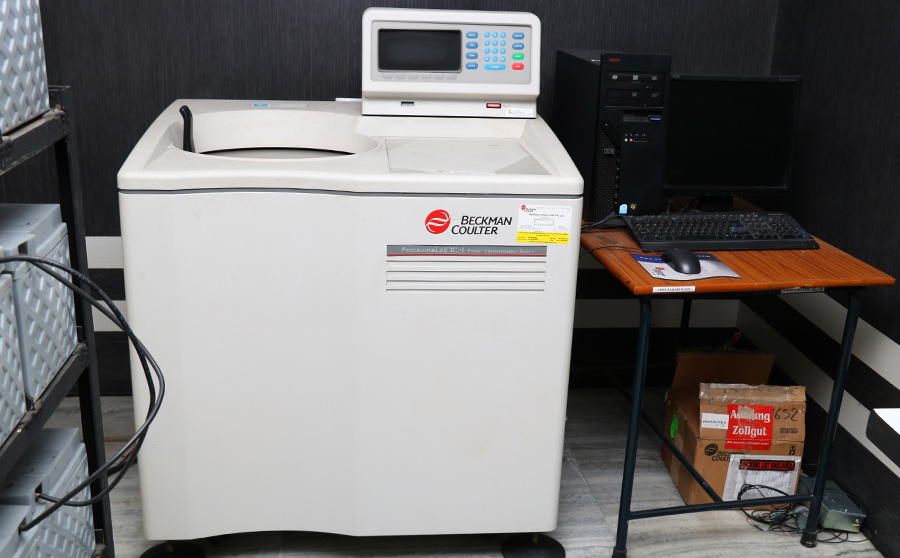
Analytical Ultra Centrifuge
FOCUS OF RESEARCH
An ultracentrifuge is a centrifuge with a very high rotor speed. In an analytical ultracentrifuge, the sample under study can be monitored by an optical detection system. The equipment produces information on shape, conformation changes and size distribution of macromolecules. The two widely used experiment type under AUC are the sedimentation velocity and sedimentation equilibrium. Sedimentation velocity experiments are used to determine the molecular weight and degree of aggregation of macromolecules. High rotor speed are used for these measurements to completely sediment all the particles in solution. Monomers and the corresponding aggregated species having different degree of sedimentation rate can be identified clearly. Sedimentation equilibrium experiments use lower rotor speed and measures the equilibrium binding constant.
EQUIPMENT DETAILS & ANALYTICAL SPECIFICATIONS
| EQUIPMENT DETAILS | |
| Speed | 1000 to 60 000 in increments of 100 rpm |
| Time | Up to 999 hours and 59 minutes; HOLD for |
| Temperature | 0 to 40°C in 1°C increments |
| Rotor temperature after equilibration | ±0.5°C of set temperature |
| Displayed rotor temperature after equilibration | ±0.3°C of set |
| ANALYTICAL SPECIFICATIONS | |
| Scanning UV/VIS Absorbance Optical System | |
| Wavelength range | 190 to 800 nm Photometric display range : 0 to 3 absorption units |
| Wavelength scan mode | up to 620 data points per scan; minimum wavelength increment step size 1.0 nm, maximum wavelength increment size 100 nm |
| Wavelength | 660 nm |
| Camera resolution | 2048 × 96 pixels |
| Laser | 30-mW Diode |
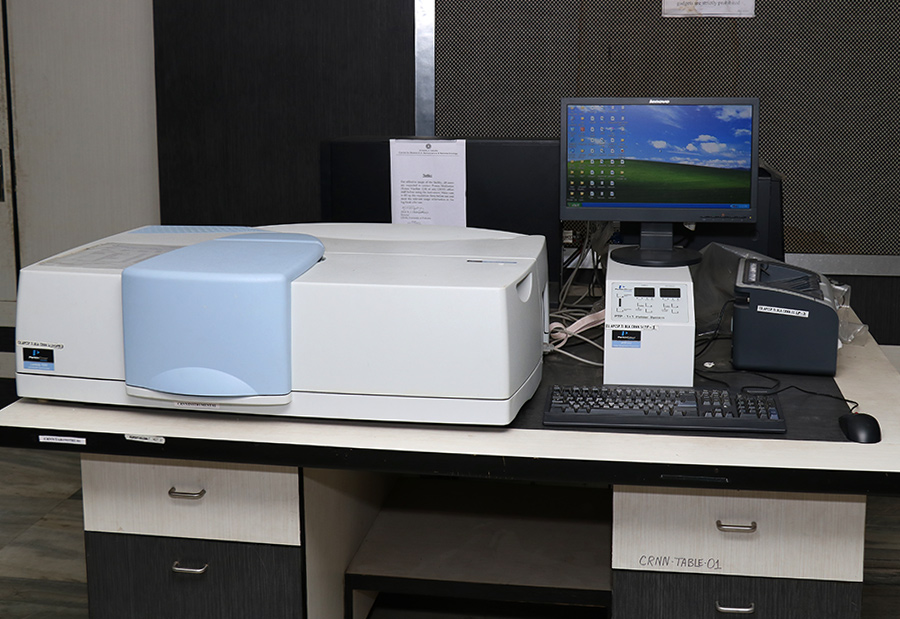
Ultraviolet (UV)-Visible (Vis)-Near Infrared (NIR) Spectrophotometer
FOCUS OF RESEARCH
UV-Vis-NIR spectroscopy oftentimes refers to absorption spectroscopy. The technique can be used for the quantitative determination of various analytes that are capable to produce signal in the spectral range of interest. System under interest absorbs light at characteristic wavelengths in the electromagnetic spectrum. The behavior is governed by the Lambert-Beer law. The absorption process results in the promotion of electrons from the highest occupied molecular orbital (HOMO) to the lowest unoccupied molecular orbital (LUMO) (in molecules) and from the valence band to the conduction band (in bulk semiconductors and quantum dots). The lowest excitonic band in the absorption spectrum corresponds to the band gap of the material. Monitoring the absorption properties of a system is of extreme importance in the field of luminescence because the absorption spectrum guides in deciding the excitation wavelength for acquiring the luminescence spectrum.
EQUIPMENT DETAILS
| UV-Vis-NIR spectroscopy | |
| Wavelength Range | 175-3300 nm |
| Optical System | All reflecting (SiO2 coated) |
| Lamp | Tungsten halogen and deuterium with automatic source change |
| Monochromator | Holographic grating monochromator with 1440 lines/mm UV-Vis blazed at 240 nm and 360 lines/mm NIR blazed at 1100 nm |
| Detector | Photomultiplier tube R6872 for the whole UV-Vis wavelength range. A 3-stage narrow band Peltier cooled InGaAs (800-1800 nm) and a single stage Peltier cooled PbS detector (1800-3300 nm) cover the NIR wavelength range. |
| Spectral Bandwidth | 0.05-5 nm for UV/Vis, 0.2-20 nm for NIR |
| Sample Compartment and Detector Module | Interchangeable |
| Integrating Sphere | The sphere is spectralon coated, wavelength range 200-2500 nm |
| Sample | Solid, Liquid |
| Collection Mode | Absorbance, Transmittance, Reflectance |
| Temperature Controller | Peltier system, temperature range 0°C to 100°C. |
| Software | UV WinLab V6. |
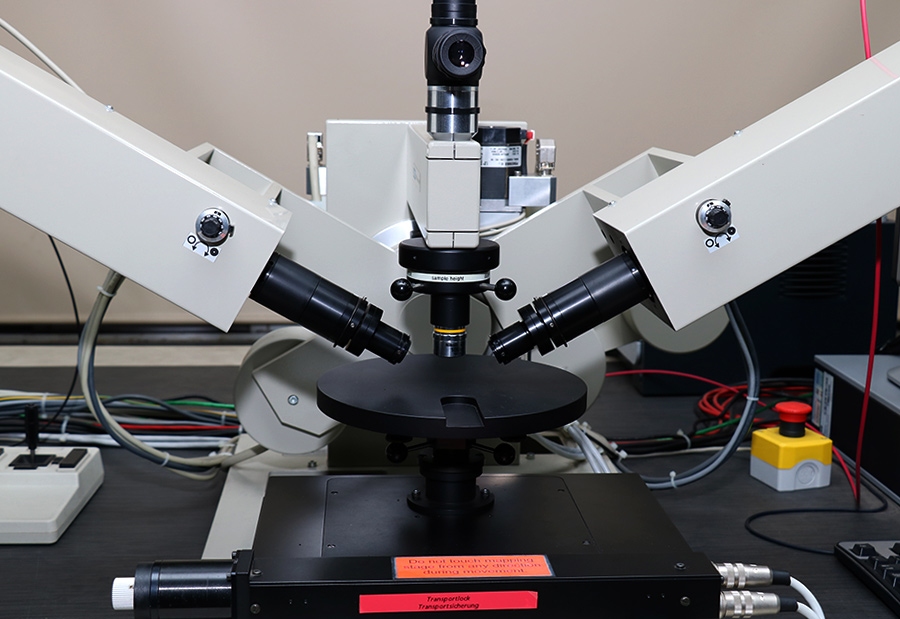
Spectroscopic Ellipsometer
FOCUS OF RESEARCH
The layer thickness and dielectric properties of a material can be investigated by ellipsometry. The technique is based on the measurement of the change of the polarization of a linearly localized light that is reflected from a surface. The instrument consists of a light source, a polarizer, sample, an analyzer and a detector.
EQUIPMENT DETAILS
| Spectroscopic Ellipsometer | |
| Wavelength Range | 190-2500 nm |
| Light Source | Deuterium lamp (deep UV), Tungsten halogen lamp (Vis), Tungsten halogen lamp (NIR) |
| Spectrometer | Deep UV-Vis: high sensitive CCD array detector, grating, spectral range 190-950 nm, spectral resolution < 1.5 nm NIR: Varian FTIR spectrometer, spectral range 750-3500 nm, spectral resolution 30 cm-1 - 1 cm-1 |
| Goniometer | Vertical manual goniometer, 40° to 90°, 5° steps, accuracy ± 0.02° |
| Sample Stage | Fixed height and tilt adjustable horizontal sample stage, sample platform with 150 mm diameter |
| Sample Alignment | Auto-collimating telescope and microscope, accuracy of 1 arc minute |
| Polarizer | High grade MgF2 Rochon prisms, extinction rate 10-6, angular resolution <0.01° |
| Compensator | Highly stabilized compensator for DUV-NIR spectral range, super achromatic compensator in UV-Vis spectral range to compensate any depolarization effect that can be caused by non-uniformity of the system. |
| Software | SpectraRay II. Measurement of (psi, delta), (tan[psi], cos[delta]), Fourier coefficients (S1, S2), transmission T and reflection Rs in dependence of wavelength and energy. |
| Measurement Performance | Psi, delta: ± 0.02° for psi (UV-Vis), ± 0.04° for delta (UV-Vis) |
| Thickness Range | Transparent films ~ 200.000 nm, absorbing films: depends on absorption index. |
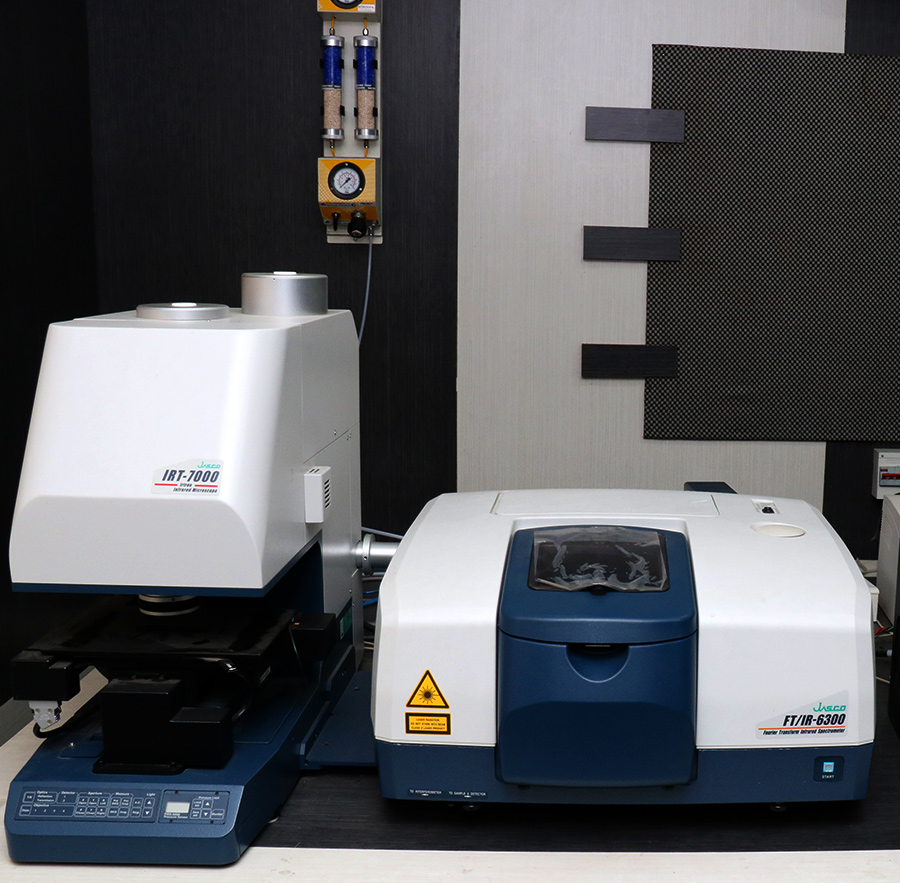
Fourier Transform Infrared Spectroscopy (FTIR) with Photo Imaging Device
FOCUS OF RESEARCH
An infrared spectrum of a solid, liquid or gas can be obtained by FTIR technique. This is primarily used for determining the chemical structure of materials by revealing the characteristics frequencies of a chemical functional group. FTIR has unique advantages over the dispersive spectrometer (collection of signal over the entire spectral range simultaneously resulting in a faster data acquisition, better signal to noise ratio owing to lesser loss from optics, use of laser as an internal standard for precise measurements by wavelength calibration). The collection of signal in an FTIR instrument relies on an interferometer. The interferometer design consists of a light source, a beam splitter, one stationary mirror, one moving mirror, sample and a detector. The beam in the direction of the moving mirror travels a different distance compared to the optical path in the direction of the stationary mirror. Upon combination of these two beams, some of them interfere constructively and some destructively. This creates the interference pattern (interferogram) at the beam splitter. Sample under interest absorbs at some portions of the spectral range, the transmitted part reaches the detector. The detector collects the signal from the entire spectral range simultaneously. The detector signal is Fourier transformed to obtain the corresponding transmittance and hence the absorption spectrum. The FTIR equipment is combined with the photo imaging device.
EQUIPMENT DETAILS
| Jasco FT/IR-6300 Fourier Transform Infrared Spectrometer equipped with JASCO IRT-7000 Intron Infrared Microscope | |
| Wavenumber Range | 7800-350 cm-1 |
| Expandable wavenumber Range | 15000-20 cm-1 |
| Resolution | Better than 0.4 cm-1 |
| Beam Splitter | Germanium coated KBr substrates |
| Light Source | High intensity ceramic |
| Signal to Noise Ratio | 50000:1 Detector: DLATGS with Peltier element (KRS-5) |
| FTIR Microscope Principle | FTIR microscope with cassegrain optical system |
| Measurement Method | Transmission/Reflection |
| Wavenumber Range | Linear Array MCT (7000-750 cm-1, expandable to 10000 cm-1), mid band MCT (7800-650 cm-1, expandable to 15000-400 cm-1) |
| Detector | MCT |
| Signal to Noise Ratio | 1000:1 (Linear array MCT detector), 5000:1 (mid band MCT detector) |
| Sample Observation | High resolution CMOS camera, 1.3 million pixels with 3X optical zoom |
| Observation Options | Visible polarization, Differential interference, Fluorescence observation, Refractive observation |
| Objectives | 10X |
Particle Size Analyzer (DLS)
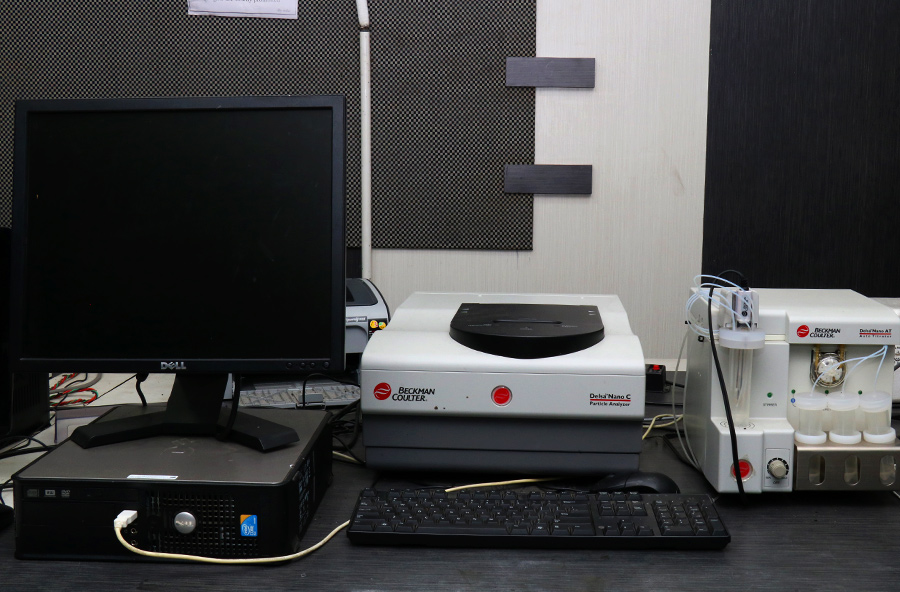
FOCUS OF RESEARCH
Dynamic light scattering (also known as photon correlation spectroscopy) is an analytical technique to determine the size distribution of macromolecular solutions. The technique relies on determination of rate of fluctuations of laser light intensity that is scattered by particles. This is performed by measuring the second order autocorrelation function of the intensity trace. At longer times, the autocorrelation function decays exponentially. The exponential function is related to the translational diffusion co-efficient and hence to the motion of the particles. The instrument is equipped with zeta potential experiments.
EQUIPMENT DETAILS
| Delsa Nano C | |
| Size Range | 0.6 nm to 7 microns in diameter |
| Measurement Technique | Dynamic light scattering |
| Minimum Sample Volume | 20 micro liter |
| Particle Size Measurement | Able to measure in both aqueous and non aqueous solution phase |
| Molecular Weight Measurement Range | 1E3 to 3E7 Daltons |
| Minimum Sample Volume | 20 micro liter |
| Principle | Laser Doppler velocimetry with phase analysis light scattering (Electrophoretic Light Scattering) |
| pH Range | 1-13 |
| Size Range | 0.6 nm to 10 microns |
| Mobility Range | ± 1.2E-3 cm2/Vs |
| Conductivity Range | Upto 200 mS/cm Zeta Potential Range: ± 150 mV |
| Minimum Sample Volume | 0.7 ml |
| Cell Type | Electrophoresis cell |
| Optics | 2 Laser (He-Ne) diodes, 658 nm, 30 mW |
| Temperature Controller | Peltier controller 2°C to 90°C ± 0.3°C |
| Zeta Cell | Quartz |